Originally posted by seldomseen
View Post
-
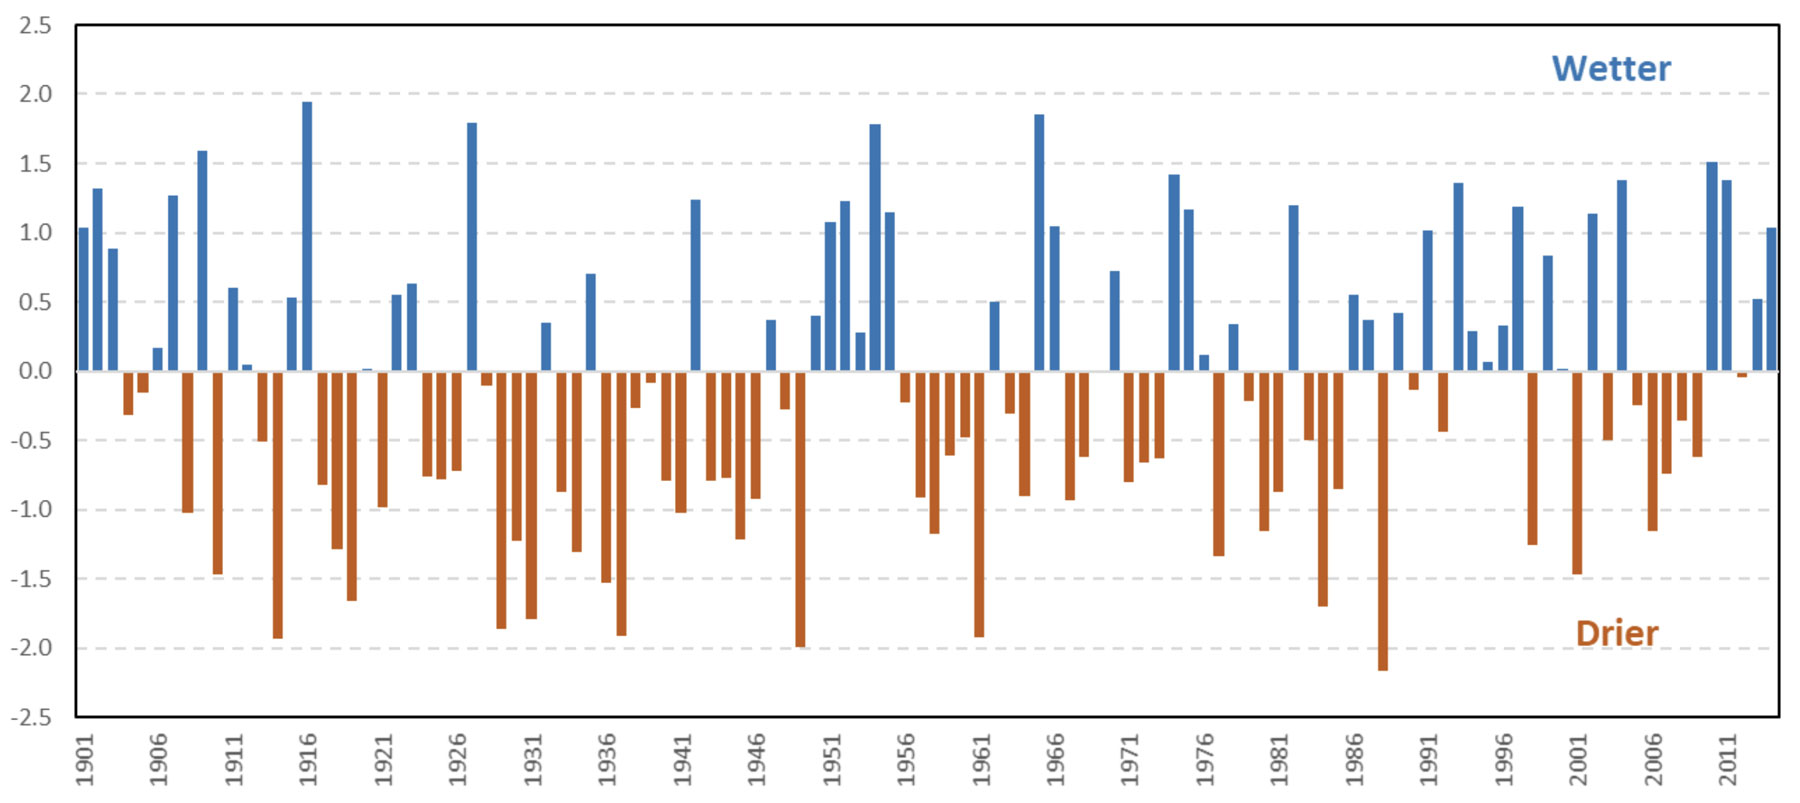
Note the declining trend in drought frequency, longevity, and severity in the era of global warming
Edit, this is for Swift Current from this site: https://climatedata.ca/case-study/drought-and-agriculture/ https://climatedata.ca/case-study/drought-and-agriculture/
Almost anyone farming today in the semi arid prairies has only known good times punctuated by short dry spells. Benign would be the best word to describe the almost ideal weather( relatively speaking) that we all know. We have no point of reference for what a return to normal would be like. Palliser probably could help us understand. The extremes of all types from early 20th century really makes one respect the pioneers who survived them, to say nothing of the extremes from prior to official records being kept.Comment
-
The 1960s were dry in Our part of north central Alberta… NE Alberta being so wet for 5 years is in shock (dry) this year.Originally posted by AlbertaFarmer5 View Post
Will need cool weather to draw the reserve moisture up to finish the crops if no rain… if cool it is amazing how plants can suck up subsoil water. August 2002 was when the hay from Ontario came on rail. 2002 Edm 235mm 473mm 2003.
The 30day average is bleak… usually what makes our crop.
https://www.agr.gc.ca/DW-GS/historical-historiques.jspx?jsEnabled=true
Hope this worked!
CheersLast edited by TOM4CWB; Jul 11, 2021, 15:33.Comment
-
Somebody mentioned Palliser? This map is a mosaic from 10-14 days ago. Hardly any cloud those days
Comment
-
This is what the paper you referenced above says about climate change and drought potential on the prairies:Originally posted by AlbertaFarmer5 View Post
"What are the Future Possible Drought Threats?
A general increasing risk of drought is expected with a warming climate for the southern Canadian prairies, despite projected increases in precipitation in some areas and seasons9. More intense and larger area droughts with increased variability are projected9,10,11,12,13. Increased drying trends are documented, especially for the Prairies, that become more dominant during the 2050s (Figures 3 and 4) and with higher emission scenarios because of higher temperatures and longer warm seasons. The severe infamous droughts of the “dirty 30sâ€, early 1960s, 1980s and early 2000s may pale in comparison with future droughts."Last edited by chuckChuck; Jul 11, 2021, 16:37.Comment
-
For Swift Current from the paper you quoted. From 1961 the historical grey SPEI trend line looks to be slightly down for the agricultural year which indicates drier conditions.
"Several measures of drought are in use, including the Standardized Precipitation Evapotranspiration Index (SPEI)7. The SPEI is a relatively simple index based on the water balance equation (precipitation minus potential evapotranspiration) which can be used to calculate drought at many time scales (e.g., one, three, six, nine and twelve months) for the historical period as well as for the future (using climate model output). Since this index includes potential evapotranspiration, the effects of projected increases in temperature in the future can also be included."
https://climatedata.ca/case-study/drought-and-agriculture/ https://climatedata.ca/case-study/drought-and-agriculture/
Bold coloured lines represent median values for the historical period (grey) and each RCP (2.6 – green; 4.5 – blue; 8.5 – red), while the correspondingly shaded areas are bounded by 10th and 90th percentile values for the historical period and each RCP.
Data Source: Tam BY, Szeto K, Bonsal B, Flato G, Cannon AJ, Rong R. (2018): CMIP5 drought projections in Canada based on the Standardized Precipitation Evapotranspiration Index. Canadian Water Resources Journal 44: 90-107Last edited by chuckChuck; Jul 11, 2021, 17:24.Comment
- Reply to this Thread
- Return to Topic List
Comment