• You will need to login or register before you can post a message. If you already have an Agriville account login by clicking the login icon on the top right corner of the page. If you are a new user you will need to Register.

Announcement

Collapse
No announcement yet.

Heat units ??

Collapse
X
Collapse
 
  • Filter
  • Time
  • Show
Clear All
new posts

    #16
    More evidence it is getting hotter and hotter. NOT

    Click image for larger version

Name:	Soybeans in SK.jpg
Views:	2
Size:	39.2 KB
ID:	769852

    Comment


      #17


      76% of normal here. I doubt we’ll catch up anytime soon

      Comment


        #18
        I don't want to play this game anymore, this is just depressing to see how far behind we are, and how low we are at the best of times. Tried to upload an image, and it just doesn't.

        Station to my south indicates we are at 284 vs average of 408 CHU. 69% of average. Just looked at some charts of CHU, GDD, frost free days, growing season length for 3 different local stations. All of them peaked in late 1990's, and have been in decline ever since.

        Most of us (cold region) farmers are already resigned to the fact that the good times are over, and we need to adapt to shorter colder growing seasons for many years yet. Any guesses when Chuck and the political class take the hint? I'm guessing that when that happens, it is probably time to start planning for the next upswing.

        Edit, and I thought we had it bad, I just looked up Red Deer:
        Current: 16.38 Year AVG: 309.308333335

        Which does cast some doubt on the veracity of the rest of the numbers. Although East of Red Deer has a frost warning tonight. We do to, forecast of +2. Record low today is -3 in 2016 here.
        Last edited by AlbertaFarmer5; Jun 19, 2020, 00:20.

        Comment


          #19
          I would guess that that majority of stations in Sask , Alberta and even Manitoba will average close to 20% below average . We are 18%
          Real time Data ....... trumps scientific studies lol
          Boots on ground as Rick Lagina says

          Comment


            #20
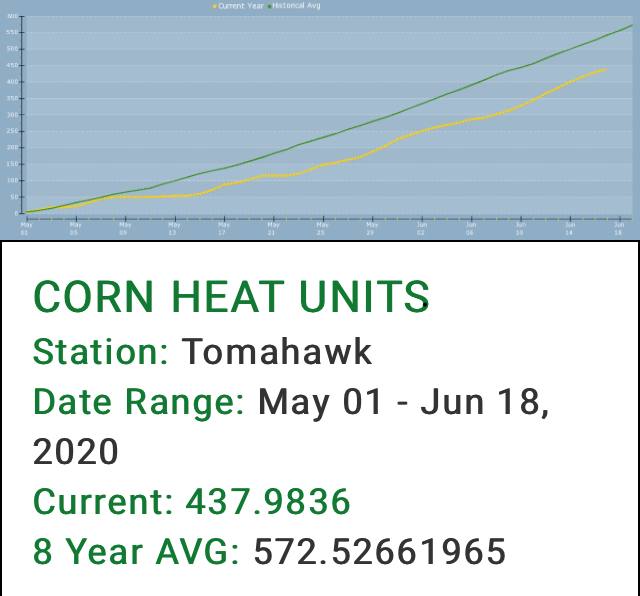
            The canola seems to be at least two weeks ahead of last year, but we took that crop off in late Oct, early Nov. and it wasnt even 100% ready then. Heat and gly took almost a month to work at that time of the year.

            And it sure seems these newer invigour hybrids are slow to get out and get going.

            But thats not the only crop. There are guys with chicks that arent higher than an inch or two. Watched some of those harvested in November too.

            Comment


              #21
              Originally posted by AlbertaFarmer5 View Post
              Chuck seems to have been busy lately, and has allowed the blasphemy on this thread to go unchallenged too long already, so I will step in and put an end to this nonsense.
              Here is irrefutable proof that our GDDs are increasing, and therefore your irrelevant graphs, and observational evidence is wrong. A map from 2080 showing how many for heat units we are already going to be enjoying here in Alberta. Models always trump evidence. Now quit being flat earther's, and start planting those pineapples and bananas.
              Believe the science, a consensus of all the people who agree with me endorse this message, and you're just a bunch of dumb farmers farmers who clearly don't know how to read a graph or use a website, you probably have it upside down. And since you are all racist, I automatically win this debate.
              I forgot the link, still can't get pictures to post...
              https://open.alberta.ca/dataset/89a69583-a11b-4e31-a857-b311ab6563cc/resource/17ce2d24-ba7b-466c-acd9-33a2cf6beb69/download/aep-alberta-climate-report-arc.pdf https://open.alberta.ca/dataset/89a69583-a11b-4e31-a857-b311ab6563cc/resource/17ce2d24-ba7b-466c-acd9-33a2cf6beb69/download/aep-alberta-climate-report-arc.pdf

              Comment


                #22
                Longest day of the year will have some very chilly temps .
                Hopefully July is warmer than “normal”

                Comment


                  #23
                  Originally posted by furrowtickler View Post
                  Longest day of the year will have some very chilly temps .
                  Hopefully July is warmer than “normal”
                  Eternal optimism ................. check

                  I’d be happy with a return to “normal” here😉

                  Comment


                    #24
                    We haven’t been above 10 degrees since last Tuesday and that’s the day I sprayed Simplicity on my wheat. Haven’t been back for a look since spraying because all dirt roads to get there and it has rained continuously since Tuesday night. I have used Simplicity lots in other years and have liked the job it dose. Don’t think there has been such a cold week in the middle of June in my farming career.
                    Any idea when the sun might get a little active and throw a more heat towards earth?

                    Comment


                      #25
                      https://www.weather.gov/news/190504-sun-activity-in-solar-cycle

                      Good article ... there are many out there

                      Long story short .... maybe by 2023

                      Comment


                        #26

                        Comment


                          #27
                          Click image for larger version

Name:	map-blended-mntp-202003-202005.jpg
Views:	1
Size:	19.3 KB
ID:	769857

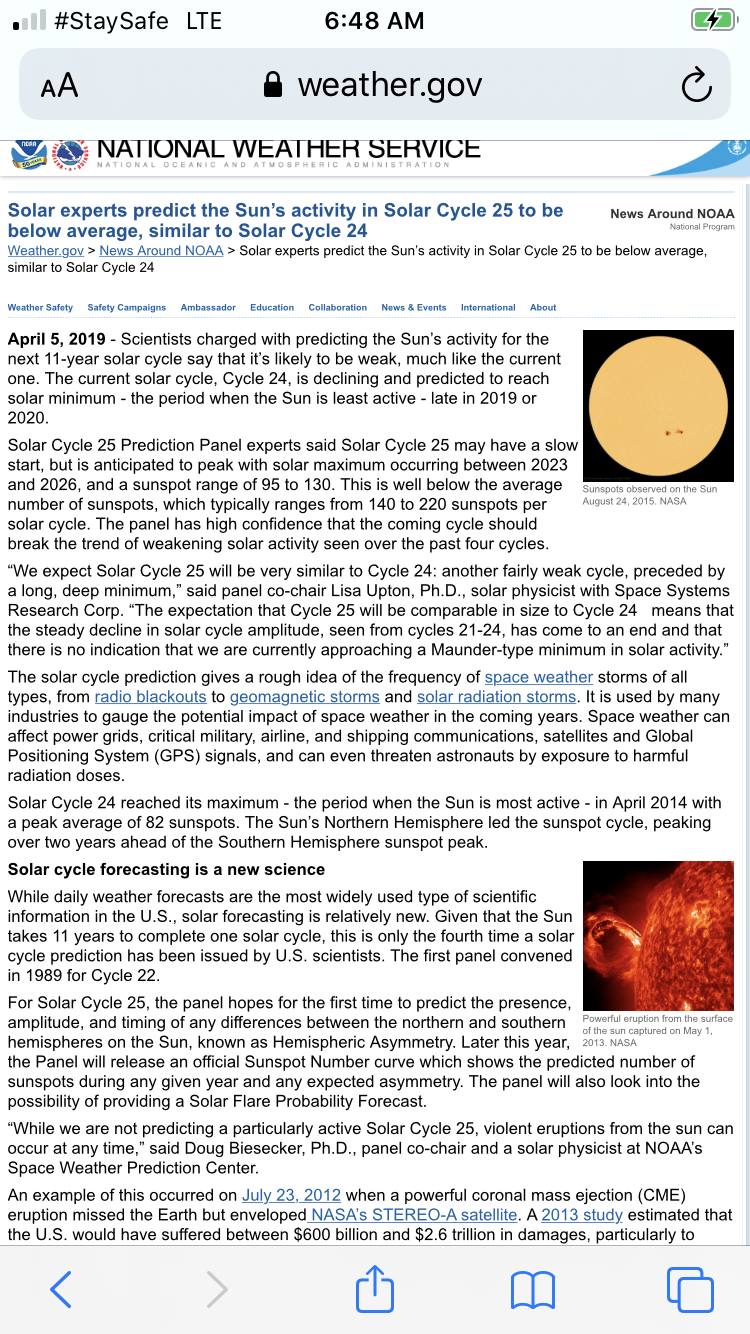
                          NOAA's temperature maps for March April May show that indeed much of Western Canada was well below normal.

                          But NOAA is not to be believed correct. Their data is made up and they are part of the conspiracy?

                          It seems as if we have been stuck in a blocking pattern again. Whether this has anything to do with the position of the jet stream I am not sure.

                          Again you need to look at long term trends when looking at climate change and forget about regional variability in any short term period. If you look at the map you can see that northern asia temperatures have been really above normal. So what is the explanation?

                          Comment


                            #28
                            If solar activity is the explanation for cooler than normal weather in North America how do you account for hotter than normal weather in Asia?

                            Comment


                              #29
                              Originally posted by chuckChuck View Post
                              If solar activity is the explanation for cooler than normal weather in North America how do you account for hotter than normal weather in Asia?
                              Why is the period from 1981-2010 considered normal weather in your opinion? If we went back to 1990 and made the same map but used temperature averages from 1951-1980 what would happen? What if you took temperatures during the 1930’s and compared them to the average temperatures from 1890-1920? The earths environment has existed for millions of years, taking a 30 year window and building your whole outlook around that is like walking into a quarter section of wheat grabbing one head and believing that is the answer!

                              Comment


                                #30
                                It would be interesting to see that data and maps from a longer period to be sure. NOAA has that but probably doesn't include as much satellite temperature data for the whole earth.

                                Comment

                                • Reply to this Thread
                                • Return to Topic List
                                Working...