• You will need to login or register before you can post a message. If you already have an Agriville account login by clicking the login icon on the top right corner of the page. If you are a new user you will need to Register.

Announcement

Collapse
No announcement yet.

Crop Yields

Collapse
X
Collapse
 
  • Filter
  • Time
  • Show
Clear All
new posts

    #46
    Originally posted by furrowtickler View Post
    This map will indicate yields
    Past 60 days rainfall percentage of average on top of low sub soil reserves...


    Really can’t argue about it ... period .
    And please correct me if I am wrong, but don't the worst affected areas also correlate with the typically most productive areas?

    Comment


      #47
      See that green dot east of Regina...thats the Ghetto! Or damn close to it.

      Lines and boundaries are arbitrary.

      Comment


        #48
        Originally posted by farmaholic View Post
        See that green dot east of Regina...thats the Ghetto! Or damn close to it.

        Lines and boundaries are arbitrary.
        See the brown dot between Edmonton and Calgary and a bit west? That is the new slum of the ghetto, formerly known as the rain forest where we farm.

        Comment


          #49
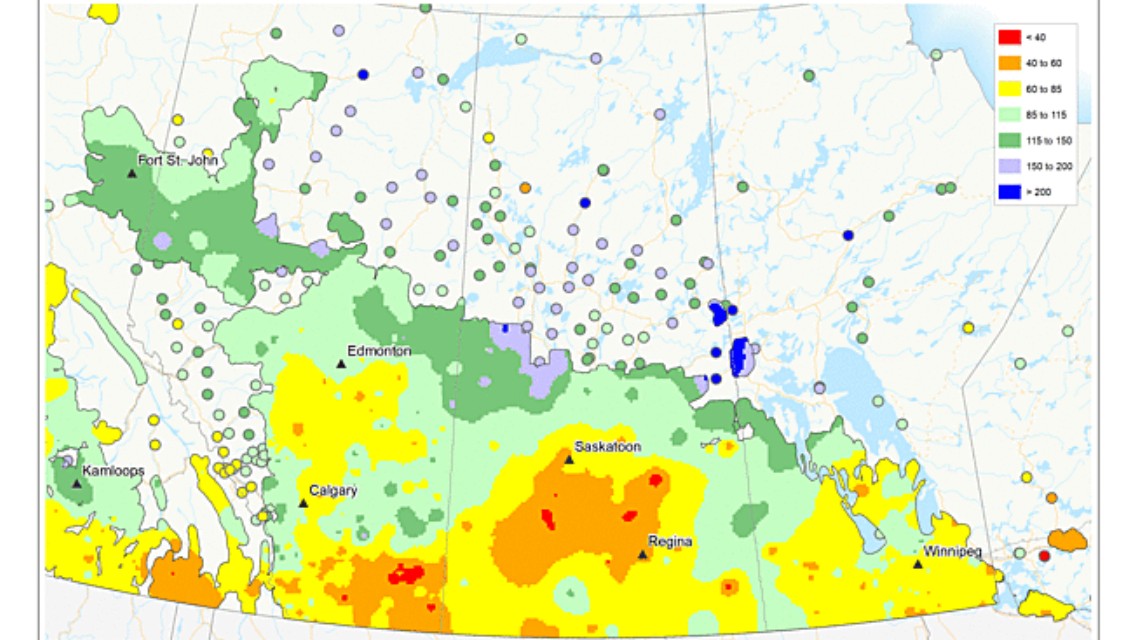
          That map sums up the crop to a T.

          Yes we’re lime green.

          Alberta the corridor is the most productive in Alberta.

          Sask that brown area grows lots of grain.

          Yea it’s no bumper.

          Comment


            #50
            I am in that yellow dot between Stoon and Lloyd
            One area of high moisture not showing is a line from Cutknife through Maidstone Lashburn to Paradise Hill

            Comment


              #51
              Can't seem to find a map for southern Ontario.

              But it would have a lot of brown dots right beside green ones.

              We were fortunate here - the rains came in time to save the corn and beans. But that changes in about a 10 mile radius, then green again. No complete disasters around here, for sure.

              CCAs are seeing some of the biggest potential ever in many fields - pod counts, seed set, cob size.

              But north of us 1/2 hr the corn was 3'-4' tall and tasseling; very short and sparse soy stands.

              Comment


                #52
                Originally posted by furrowtickler View Post
                This map will indicate yields
                Past 60 days rainfall percentage of average on top of low sub soil reserves...


                Really can’t argue about it ... period .
                I think were the little brown dot in southwest Manitoba.
                Took off the first field of wheat yesterday. For only 5" of rain since seeding, it's yielding pretty good. Bushel weight is 65+, which is a surprise too.

                Comment


                  #53
                  Originally posted by furrowtickler View Post
                  This map will indicate yields
                  Past 60 days rainfall percentage of average on top of low sub soil reserves...


                  Really can’t argue about it ... period .

                  Due to technical difficulties, not all of our map products under Current Conditions Agroclimate Maps are up-to-date. Generally, the daily products are current to August 2, 2018; archived products are not affected. We will provide a status update on or by August 21. For more information, please contact us.

                  Comment


                    #54
                    those maps extrapolate a few data points over too wide of a region. my area shows yellow, but I'm definitely in a brown zone. If analysts are relying on these maps to predict yield, they will be overestimating.


                    Also using radar maps to determine accumulated moisture will also result in over stating the amount of beneficial rains this year. Many times the green/dark green on the doppler radar didn't even hit the ground, or if it did the rainfall was less than 5 mm, that had zero benefit to the crop as it evaporated within hours.

                    Comment


                      #55
                      Originally posted by MBgrower View Post
                      those maps extrapolate a few data points over too wide of a region. my area shows yellow, but I'm definitely in a brown zone. If analysts are relying on these maps to predict yield, they will be overestimating.


                      Also using radar maps to determine accumulated moisture will also result in over stating the amount of beneficial rains this year. Many times the green/dark green on the doppler radar didn't even hit the ground, or if it did the rainfall was less than 5 mm, that had zero benefit to the crop as it evaporated within hours.
                      That was definitely the case here. But more like much less than 0.5 mm when the green and dark green went over. 5mm would have been extremely helpful...

                      Comment


                        #56
                        End of the day that map , in general anlong with low subsoil moisture will tell the tale . There are always micro climates within any moisture, rain fall map .

                        Comment


                          #57
                          A good example is starting just 2 miles west has had over 20 mil more rain than here . It does not show up on a map that general but the overall trend is close

                          Comment


                            #58
                            Originally posted by furrowtickler View Post
                            End of the day that map , in general anlong with low subsoil moisture will tell the tale . There are always micro climates within any moisture, rain fall map .
                            The complete lack of subsoil has been the much bigger issue around here this year. Pipeline across neighbors new hay field right now, it is pure powder all the way down. I've never seen this clay that dry. It would normally be one sticky clump the size of the bucket. We have this unknown quantity called dust even.

                            Comment


                              #59
                              Originally posted by Jay-mo View Post
                              I think were the little brown dot in southwest Manitoba.
                              Took off the first field of wheat yesterday. For only 5" of rain since seeding, it's yielding pretty good. Bushel weight is 65+, which is a surprise too.
                              Some different and bigger brown (yellow) dots on this one Jay-mo. All in the 4-6" range for May 1 to Aug 12 precipitation.

                              Click image for larger version

Name:	Screen Shot 2018-08-19 at 3.40.17 PM.jpg
Views:	1
Size:	20.0 KB
ID:	766666

                              Link to the original zoomable version here http://www.gov.mb.ca/agriculture/weather/pubs/total-acc-precipitation.pdf http://https://www.gov.mb.ca/agriculture/weather/pubs/total-acc-precipitation.pdf

                              Comment


                                #60
                                We are located in that light green to dark green circle 200 miles straight south of Saskatoon. Lentils yielding 15 -30 , Durum 30-50 no canola or chickpea done yet. Lentil stubble yielding much better than canola stubble. Thunderstorm lottery playing a big part this year.

                                Comment

                                • Reply to this Thread
                                • Return to Topic List
                                Working...