
When you look at the following accumulated precipitation map it becomes quite clear how small the line is where there is good crop .
The dark green line shows what we see here in the NW when you do a crop check drive . It is a very narrow band across western Canada that had decent rains in June and early July basically.
Most of the crop north of that line has been flooded out for a month or still severely delayed .
Most crop south of that line has been drought stressed and crops will be 30-70% below normal yields .
There will be a few exceptions but in general this map tells the tale this year
Rains going forward will do more harm north of that line and south of that line will do little or even just down grade crops ready for harvest .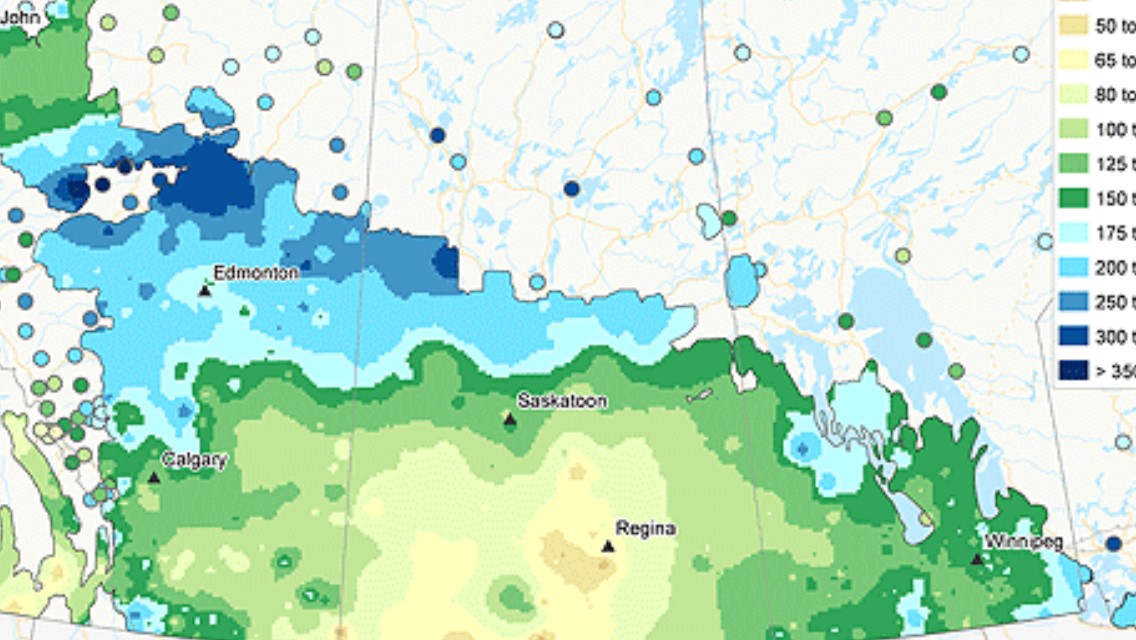
That's my 2017 crop report lol
Comment